What is spectroscopy?

.webp)

.svg)
Spectroscopy is a way to fingerprint what’s in a liquid by analyzing how it interacts with different frequencies of light. Using optical spectroscopy techniques, we shine light through (or off) a sample and measure how that light changes.
Different substances absorb and reflect specific wavelengths of light in their own characteristic patterns — like barcodes — allowing spectroscopic analysis to identify what’s flowing through a production line without ever pulling a sample.
At Laminar, we use advanced spectroscopy capabilities to speed up cleaning cycles (CIP), reduce product loss during changeovers, and catch costly process errors — all automatically and in real time.
Our inline spectral sensors read a liquid’s “fingerprint,” and our ML models translate that into sub-second decisions for plant PLCs.
The Science of Spectroscopy: The 10-second Version
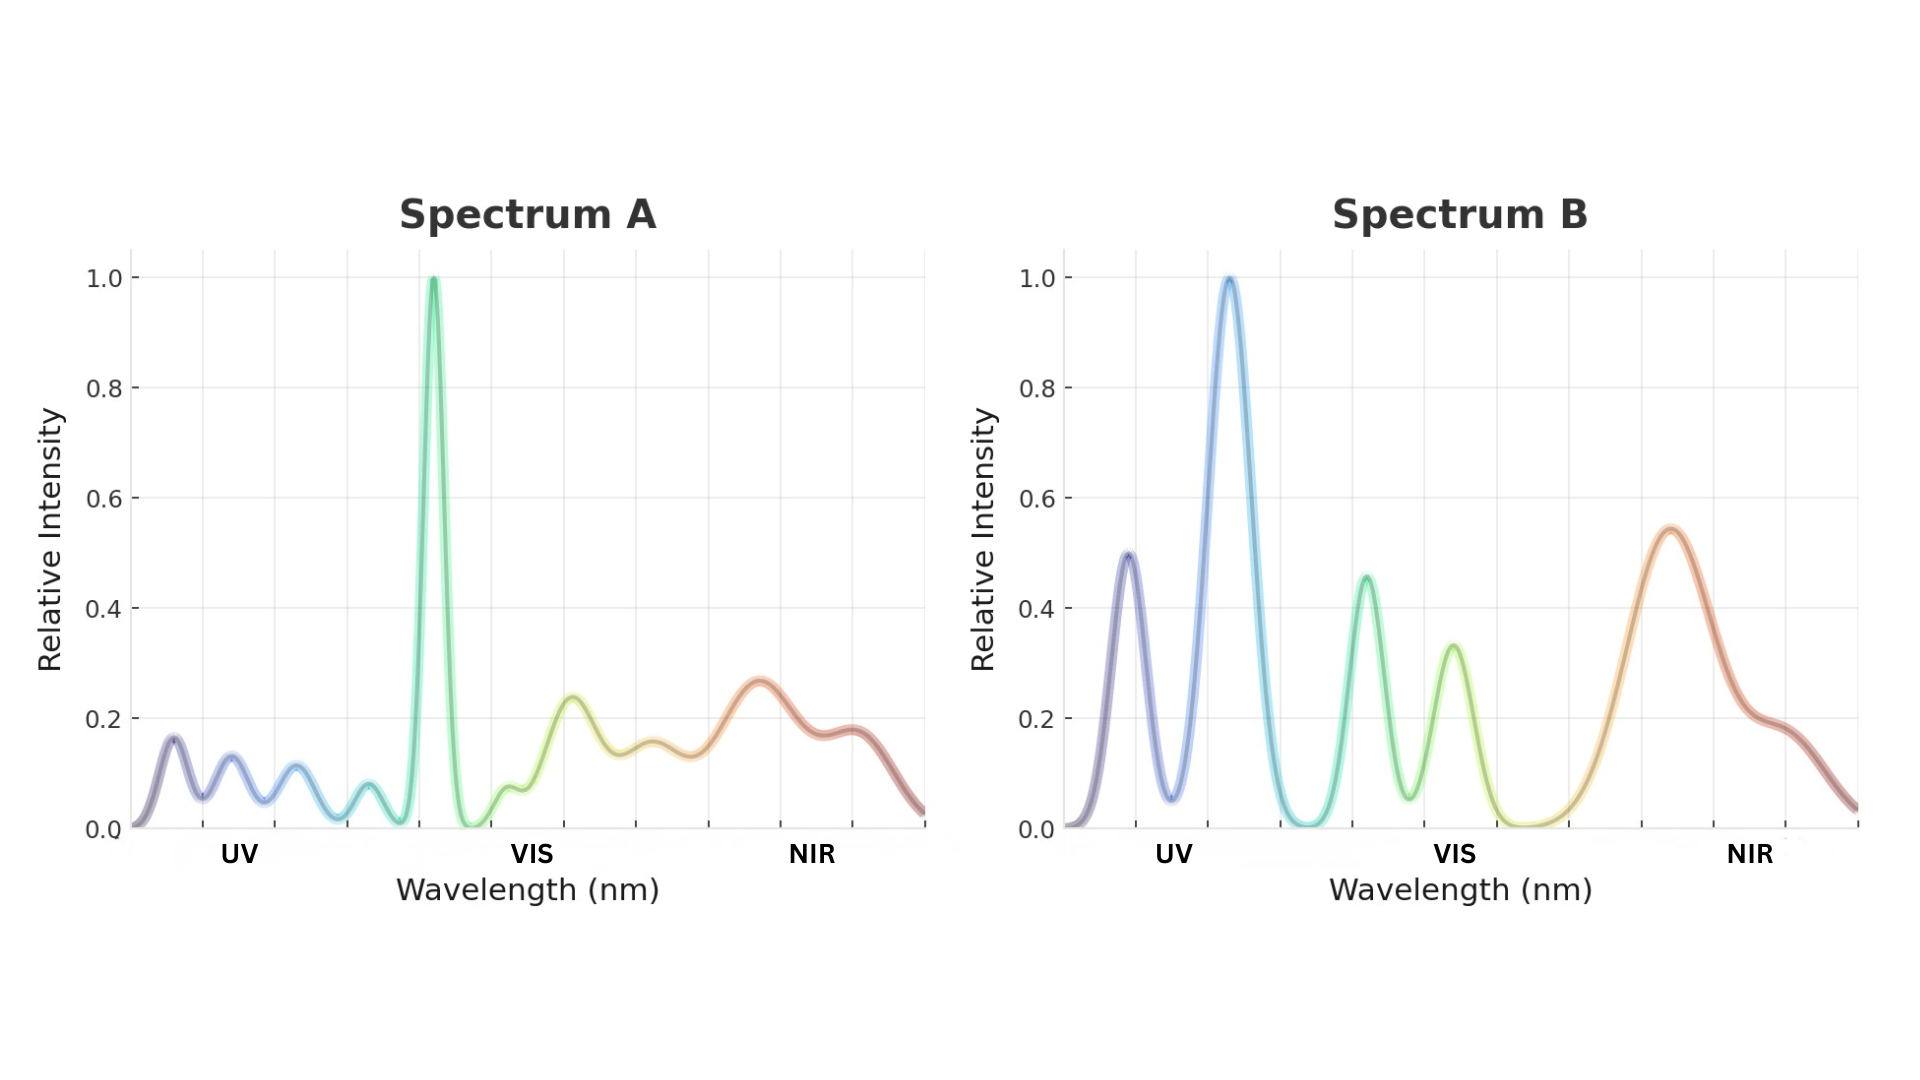
- Light + liquid = fingerprint. Each liquid interacts with light at specific frequencies of light to create unique spectral patterns
- We measure continuously, inline. Our sensors collect UV/VIS/NIR spectra (ultraviolet, visible, near-infrared) right in your piping — no grab samples.
- AI turns spectra into actions. We tailor models to your line so your PLC can shorten CIP, tighten changeovers, and prevent mix-ups.
Where on the light spectrum do our inline spectral sensors look?
Our Laminar spectral sensors focus on three types of spectroscopy across the electromagnetic spectrum:
- Ultraviolet (UV) Spectroscopy
- Visible (VIS) Spectroscopy
- Near-Infrared (NIR) Spectroscopy
This range allows us to capture absorption spectra that reveal both the physical properties and chemical composition of materials. Near-infrared light is particularly useful for detecting molecular vibrations in organic compounds, while UV and visible ranges excel at identifying specific atoms and molecular structures.
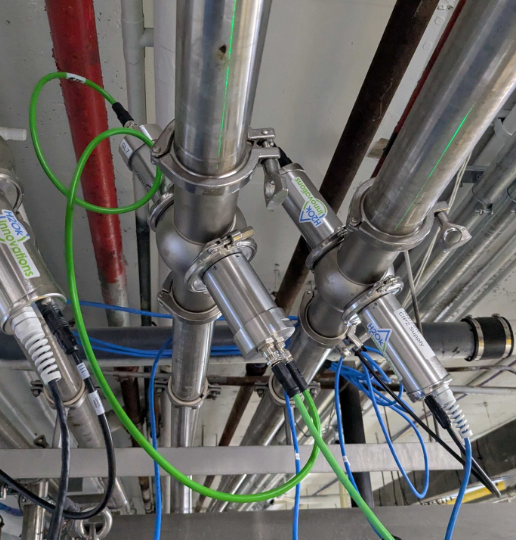
How our spectral sensors measure inline light emission (reflectance + transmittance)
We typically install paired sensors to capture both light absorption and emitted light at certain wavelengths:
- Transmittance sensor: measures the amount of light that passes through the liquid.
- Reflectance sensor: measures the amount of light that bounces back from the liquid.
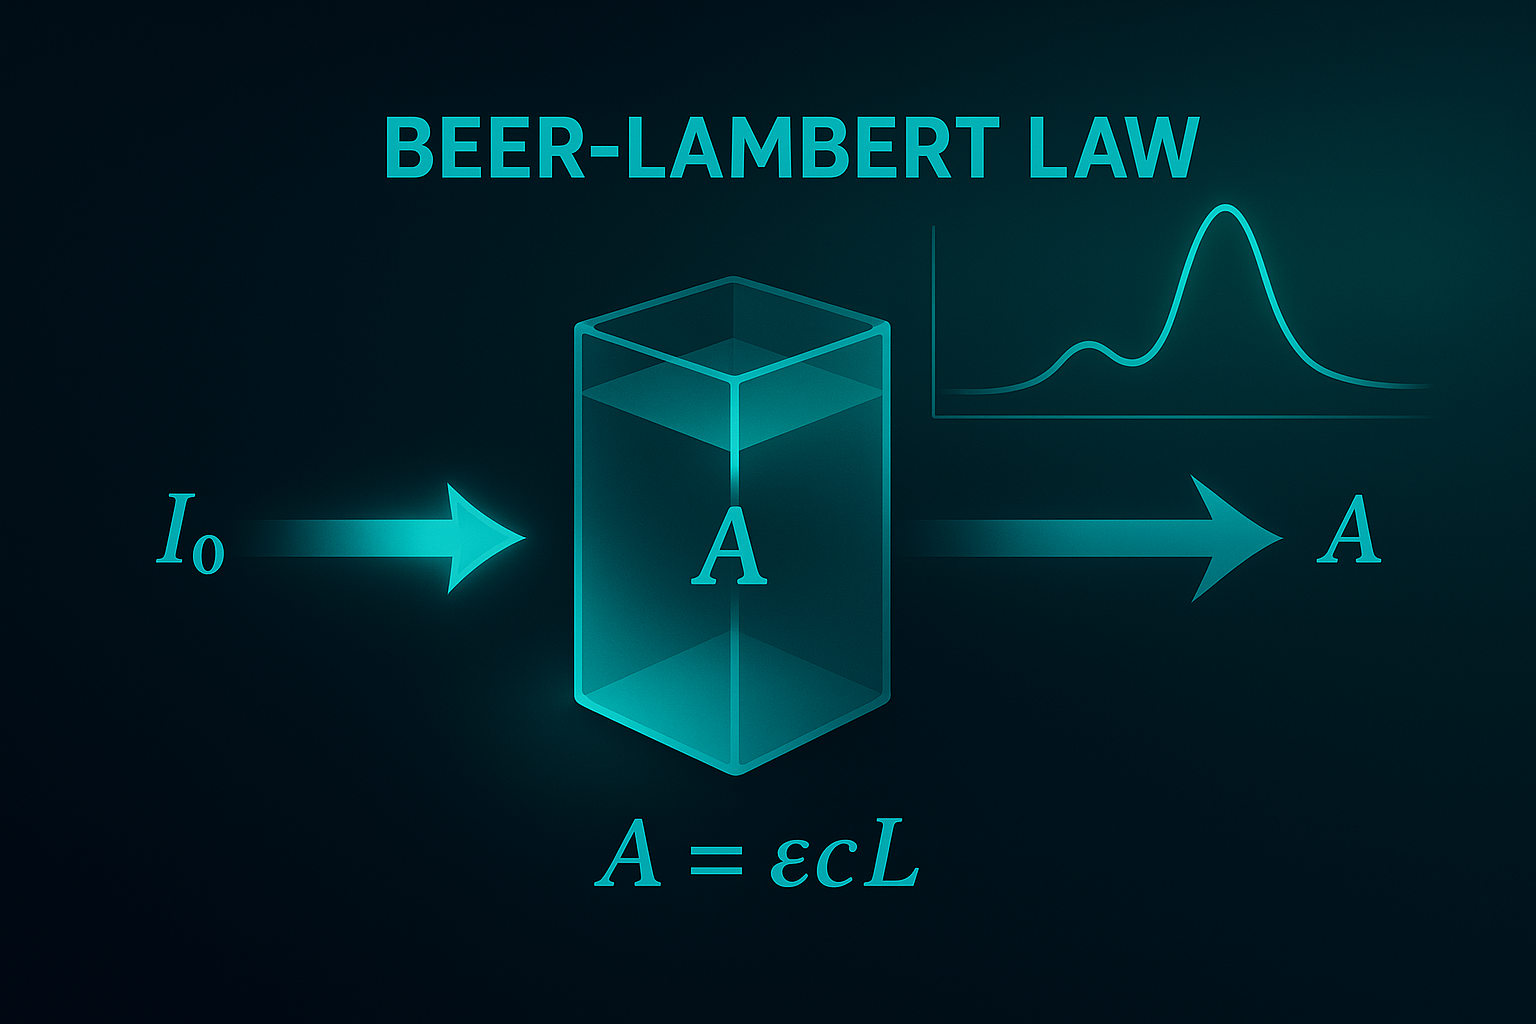
From those measurements, spectroscopic techniques compute absorption spectra (i.e., absorption spectroscopy), which indicate how strongly a liquid absorbs each different wavelength. The more of a substance you have, the more it absorbs at its characteristic wavelengths.
This follows the Beer–Lambert law, commonly written as:
A = ε · b · C
Where A = absorbance, ε = molar absorptivity (basically “how strongly this substance absorbs”), b = path length (how far light travels in the sample), C = concentration.
Practically speaking, higher concentration → higher absorbance, which often shows up as lower transmittance and higher reflectance at specific wavelengths of unique spectra. By analyzing the intensity or frequency of the absorbed or emitted light, we can determine precise concentrations and identify specific compounds.
Why are inline spectra so valuable for real factories?
Optical spectroscopy is powerful because the way visible light and infrared light interact with liquid mixtures changes throughout the production cycle. During our pilot validation phase, we build a database of the spectral fingerprints unique to our customers' production line. These spectral fingerprints captured through frequency spectroscopy methods power our proprietary ML models for specific use cases.
Think about a drain header or a production manifold: streams merge, recipes switch, lines rinse and clean, and residuals can linger. Because each liquid’s spectral shape is distinctive — from the way atoms and molecules absorb light to the fluorescence they may emit — we can:
- Detect changes in product, water, chemical, and CIP states and interfaces in real time.
- Prove cleanliness (CIP validation) by watching the spectral signature converge back to baseline.
- Accelerate changeovers by cutting rinse time the moment the new product fingerprint is stable.
- Inline quality control by catching wrong-valve or mis-routing events when the absorption spectrum doesn’t match what the PLC expects.
Each of our models runs continuously on these signals, converting spectra into closed-loop actions (e.g., “advance to next CIP step,” “open valve X,” “end rinse now”). The result is reclaimed uptime and reduced product loss.
Spectrometry in action: Real-world Laminar examples
- Faster Clean-in-Place: Using emission spectroscopy and absorption spectroscopy together, we distinguish each step of the CIP cycle from product → water → caustic → water → sanitizer → water in seconds. Spectroscopic analysis informs AI models, which leverage dynamic, closed-loop automation to end and advance each step as soon as cleanliness is achieved — replacing fixed timer-based recipes.
- Product Changeover Optimization: Track organic load swings, surfactants, and color bodies through VIS features to optimize dosing and monitor upstream contributions. Our spectograph captures detailed absorption spectra that reveal even subtle changes in composition.
- Batch Optimization: Monitor reaction progress or solvent swaps inline in real-time and minimize hold-ups between unit operations with spectral fingerprints (VIS/NIR). Frequency spectroscopy methods track molecular vibrations and chemical transformations as they happen.
- Inline Quality Assurance and Control: Quickly identify product defects when spectral resolution does not match validated spectral fingerprints. By analyzing the physical properties revealed through optical spectroscopy, we ensure consistent product quality across different applications.
What about accuracy, calibration, and in an industrialized setting?
- Bubbles, turbidity, and foam can scatter light and bias readings. We handle this with paired geometry, baseline tracking, and modeling over many wavelengths — spectral redundancy helps separate true chemistry from optical artifacts. Our advanced LED-based light sources provide consistent illumination across all frequencies of light.
- Validation uses reference spectra and check standards (e.g., water or known cleaning agents) to verify that the system reads what it should in your pipes (not just on a lab bench).
- Localization matters: we tailor the ML to your product portfolio, CIP chemistries, and pipework so the system recognizes your exact fingerprints and can interpret the emitted light patterns specific to your processes.
- Ruggedized sensors: Our sensors and hardware undergo rigorous testing to meet the industrial demands of worldwide emissions, safety, and performance standards.
Understanding Spectral Resolution and Sensitivity in Industrial Applications
When implementing optical spectroscopy in industrial settings, two critical factors determine the success of spectroscopic analysis: spectral resolution and detection sensitivity. Spectral resolution refers to the ability of a spectograph to distinguish between closely spaced frequencies of light. Higher resolution means we can differentiate between similar compounds that might have overlapping absorption spectra, which is essential in complex production environments where multiple products share similar chemical properties.
Our sensors achieve high spectral resolution across the UV, visible, and near-infrared ranges by utilizing advanced detector arrays. This allows us to capture subtle variations in molecular vibrations and electronic transitions that occur when atoms absorb or emit light at specific wavelengths.
The sensitivity of our detection system is equally important — we need to measure very low concentrations of contaminants or trace ingredients while also handling the high concentrations found in pure products.
By combining emission spectroscopy with absorption spectroscopy techniques, we achieve a dynamic range that spans several orders of magnitude, from parts-per-million detection to pure substance analysis.
The Role of Machine Learning in Modern Spectroscopy
Traditional spectroscopic analysis required trained chemists to manually interpret absorption spectra and emission spectroscopy data — a time-consuming process unsuitable for real-time industrial control. Modern machine learning has revolutionized how we extract actionable insights from spectral data.
Our AI models are trained on thousands of spectral fingerprints collected during pilot validation phases, learning to recognize patterns that even experienced spectroscopists might miss.
The ML approach offers several advantages in frequency spectroscopy applications. First, it can simultaneously analyze multiple wavelengths of infrared light and visible light, to create a holistic understanding of liquid composition.
Second, it learns to compensate for real-world interference—such as temperature fluctuations, flow rate changes, or optical artifacts from bubbles and foam—that would confound traditional analysis methods. Third, it can detect anomalies by recognizing when a measured spectrum doesn't match any known product or CIP state, providing an early warning system for process deviations.
Neural Networks and Spectral Data
Our neural networks process the physical properties encoded in spectral data at microsecond speeds, translating complex patterns of molecular vibrations and electronic transitions into simple, actionable outputs for plant control systems.
Take this example: when monitoring a cleaning cycle, the ML model doesn't just report 'caustic detected' — it quantifies the caustic concentration, predicts how long until the target concentration is reached, and automatically triggers the next CIP step when spectroscopic analysis confirms cleanliness. This level of automation transforms spectroscopy from an analytical tool into an intelligent process control system.
A short glossary (plain-English)
- Spectrum / Spectra / Visible Spectroscopy: A plot of how strongly a sample absorbs/reflects each color (wavelength).
- Spectral Fingerprint: The unique shape of that plot for a given liquid or mixture.
- UV/VIS/NIR Spectroscopy: Three parts of the spectrum — ultraviolet, visible, near-infrared.
- Absorbance/Absorption Spectrum: How much light is “lost” to the sample at each wavelength.
- Beer–Lambert law: A simple relationship linking absorbance to concentration.
- Optical Spectroscopy: The study of how light interacts with matter to reveal chemical composition.
- Emission Spectroscopy: Analysis of light emitted by atoms or molecules.
- Fluorescence: The emission of light by a substance that has absorbed light or other electromagnetic radiation.
- Spectroscopic Analysis: The process of using spectroscopy data to identify and quantify substances.
- Molecular Vibrations: The oscillations of atoms within molecules that can be detected using infrared light.
- Spectograph: An instrument that separates light into its component frequencies for analysis.
What's next for Spectrometers?
The exciting part isn’t just reading spectra — it’s what happens when you combine spectroscopic analysis with plant context (recipes, valve states, flow, temperature) and AI. Advanced optical spectroscopy methods enable us to detect everything from individual atoms to complex molecular structures.
When integrated with custom flexible spectrometer configurations and real-time process data, these spectral fingerprints become automatic, line-level decisions that reclaim uptime, reduce waste, and make factories faster.
Want to learn more? Check out How it Works.
Related Blog Posts
Certification: H2Ok Innovations hardware tested to EN 61326-1:2013

How our AI-powered technology is combating climate change